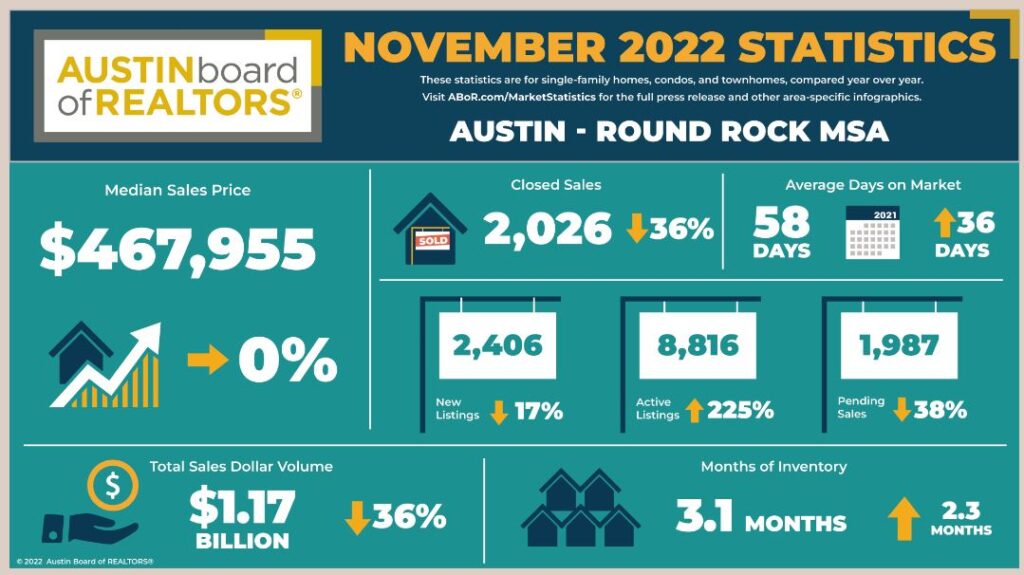
Austin real estate news from Doreen for December is here. For the first time since February 2019, median home prices in the Austin-Round Rock MSA experienced a 0% year-over-year increase. The data is according to the Austin Board of REALTORS® November 2022 Central Texas Housing Market Report. As housing inventory and days on the market continue to steadily increase across the MSA, the report indicates normal market activity could be here to stay. Austin’s housing market maintains its trajectory toward balance and sustainability. For the first time since the spring of 2020, there were no records broken for home sales or median price in either the MSA or the City of Austin.
Austin Real Estate Housing Market Statistics for Austin – Round Rock MSA 
“It’s a relief to see more homes available and sitting on the market long enough to give buyers an opportunity to think before they leap,” Cord Shiflet, 2022 ABoR president, said. “This healthy competition creates an opportunity for homebuyers, who may have struggled within the past two years, to take their time and find a home they love. At the same time, sellers who can still enjoy deep equity should connect with a REALTOR® to discuss the best way to prepare and market their home.”
Austin real estate news shows inventory supply is starting to give buyers choices
Dr. Jessica Lautz, deputy chief economist and vice president of research at the National Association of REALTORS®, reviewed the 2022 housing market on a national level, stating that level-setting expectations for homebuyers and sellers are crucial now that the market is on track toward normalization.
 “In January, we experienced the lowest inventory on a national level since 1999,” Lautz said. “The average number of offers reached an all-time high in the spring, nationally, at 5.5 offers a home, since everyone knew interest rates would increase. Because of this, we saw this frenzied pace in the market, especially here in Austin, where the massive migration flow of people from other parts of the country caused home prices to increase. This was not a good market for anyone.”
Lautz added that homebuyers should seriously consider the length of time they plan on living in a home and speak with a REALTOR®. “We have to remember that the housing market is local,” Dr. Lautz said. “As millennials age in and senior adults stay in place instead of relocating, people are facing this short housing stock, and it’s becoming an increasing issue.”
Housing inventory almost quadrupled to 3.1 months of inventory year over year for the Austin-Round Rock MSA and the City of Austin. Keep in mind there is still a long way to go before a balanced market with six months of inventory is available.
Austin Real Estate News for all of Central Texas all counties that make up the Austin Central Texas Realty Information Service (ACTRIS) and Austin – Round Rock Metropolitan Statistical Area are hovering at three months of inventory.
Austin real estate news statistics for November 2022 here
Months of inventory are calculated by taking the number of homes listed for sale and dividing it by the average amount of homes sold per month within a 12-month period.
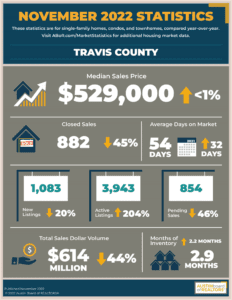 Here is the breakdown of Austin Round Rock MSA November median sold prices and year-over-year price increases. This data was originally reported in the latest Austin Board of Realtors Central Texas Housing Report.
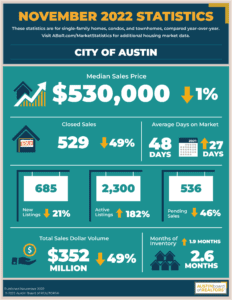
🔑City of Austin —$530,000, down 1.8% year over year
🔑Travis County — $529,000, up 0.8% year over year
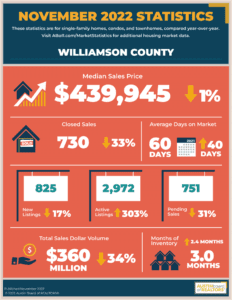
🔑Williamson County — $439,945, down 1.1% year over year
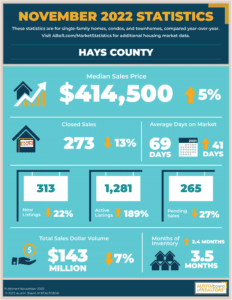
🔑Hays County —$414,500 up 5.2% year over year
🔑Bastrop County — $362,450, up 5.1% year over year
🔑Caldwell County — $331,000 up 24.1% year over year
Median Single-Family House Sold Prices for Austin, West Lake Hills, Round Rock, Leander, Elgin, Cedar Park, Buda, Kyle, and Dripping Springs
These are November’s median sold prices for single-family fee-simple houses in Austin and the surrounding cities. I ran these numbers using MLS data from the Austin Board of Realtors. Data is for single-family houses (no condos).

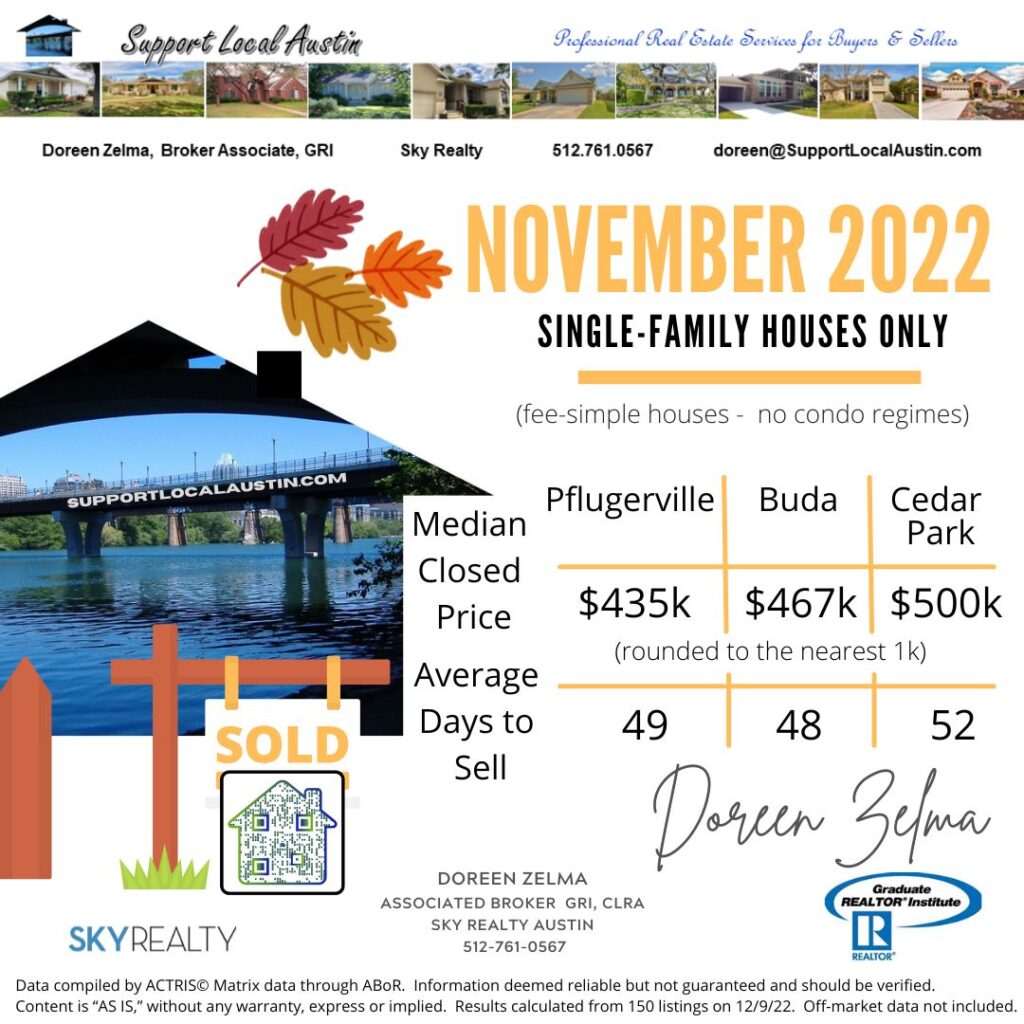

Data compiled by ACTRIS© Matrix data through ABoR. Information deemed reliable but not guaranteed and should be verified. Content is “AS IS,” without any warranty, express or implied. Results were calculated from the number of listings in the MLS at the date of the report. Off-market data not included.
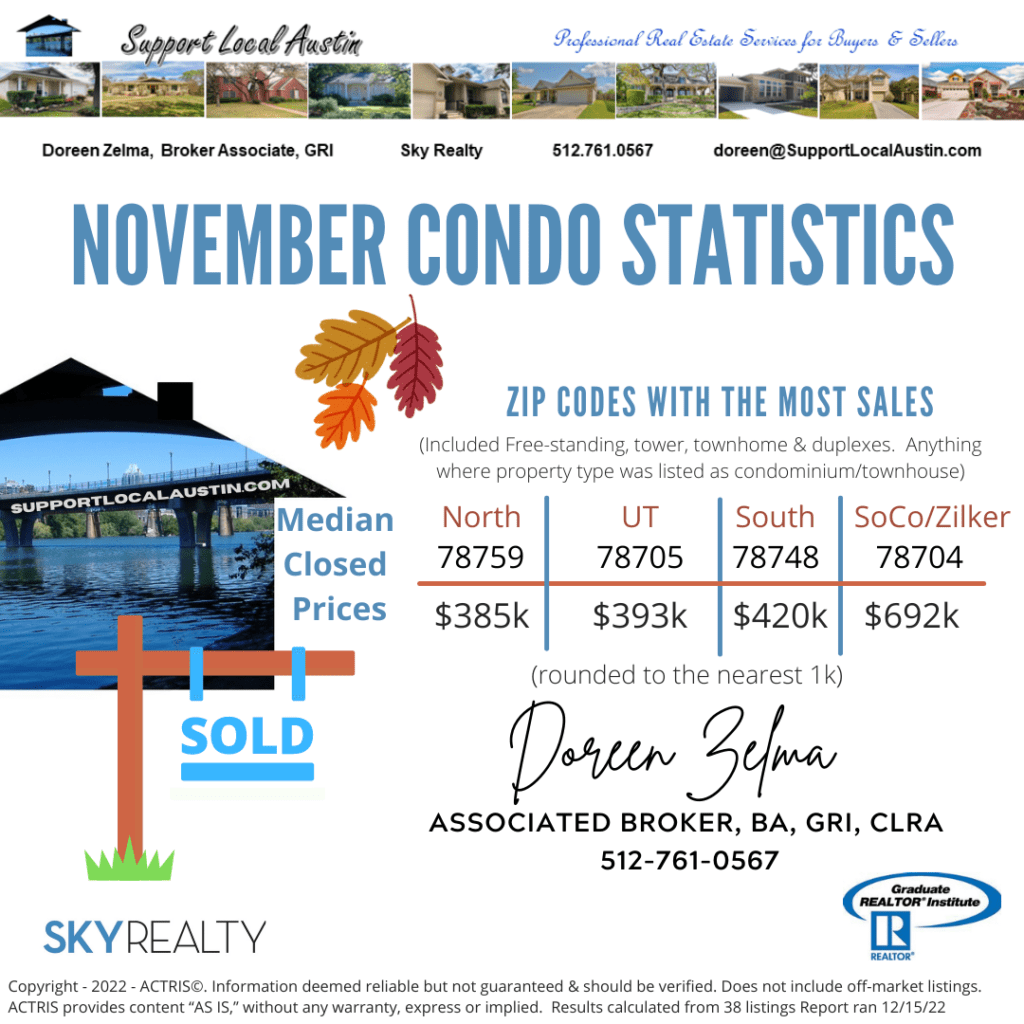
City of Austin Condo Market Snapshot
The below graphic focuses on the zip codes that had the most sold inventory. This Austin real estate market report was run on 12/15/22 and was compiled from a total of 38 listings. The report includes all types of residential condos, whether free-standing (detached), tower, townhome-style, or duplex. All types of condo regimes were included in this report. A condo dollar tends to go a little further in what it will afford someone over a fee-simple home. In some locations, condominiums can prove to be a cost-effective alternative.
Want to look at homes? Click here
Ready to start your home search? Not sure what your driving commute will be like? Put that smartphone to work. Contact us and let’s get you on a custom home search and start your path to homeownership today.

