

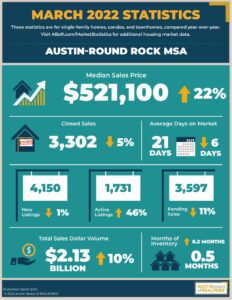
What does Austin real estate news market data look like now? According to the Austin Board of REALTORS® (ABoR), March Central Texas Housing Report residential sales declined 5.9% year over year to 3,302 homes across the Austin-Round Rock MSA last month. Combined with a new record median price, which rose 22.6% year over year to an all-time high of $521,100, the Central Texas housing market continues to outpace itself.
Austin Real Estate Housing Market Statistics for Austin – Round Rock MSA
Across the MSA in March, sales dollar volume increased 10.3% year over year to $2,130,213,961 while new listings dropped 1.2% to 4,150. At the same time, active listings jumped 46.1% year over year to 1,731, while pending sales dipped 11.1% to 3,597 across the MSA. Overall, listings spent an average of 21 days on the market, six fewer days than March 2021.
 Lila Valencia, City of Austin demographer, shared insights on Austin’s population growth and its impact on the housing market.
“According to the Census Bureau’s 2021 population estimates, Austin is experiencing a net growth of 146 people per day. This type of growth places immediate and significant demand on infrastructure, particularly housing. When a person or family moves into Austin, finding a place to live is at the top of their agenda. The latest Austin Board of REALTORS® data shows strong housing market growth in Bastrop and Caldwell Counties, a sign that people are having to look farther out from the central city, which has implications not just for the local housing markets in these areas but also for transit and transportation and access to other amenities and services.”
Austin Real Estate and all of Central Texas continue to lack a supply of readily available homes to purchase with a strong demand
 Austin Round Rock MSA March median sold prices and year-over-year price increases as originally reported in the latest Austin Board of Realtors Central Texas Housing Report.
🔑City of Austin —$624,000, up 22.4% from a year earlier.
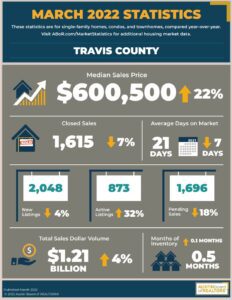
🔑Travis County — $600,500, up 22.8% from a year earlier.
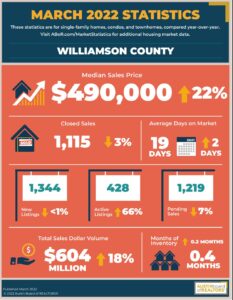
🔑Williamson County — $490,000, up 22.5% from a year earlier.
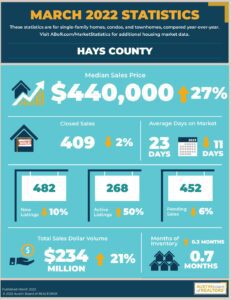
🔑Hays County —$440,000, up 27.6% from a year earlier.
🔑Bastrop County — $405,500, up 46.9% from a year earlier.
🔑Caldwell County — $329,000 up 31.2% from a year earlier.
Median Single-Family House Sold Prices for Austin, West Lake Hills, Round Rock, Leander, Elgin, Cedar Park, Buda, Kyle, and Dripping Springs
These are March’s median sold prices for single-family fee-simple houses in Austin and the surrounding cities. I ran these numbers using MLS data from the Austin Board of Realtors. Data is for single-family houses (no condos).
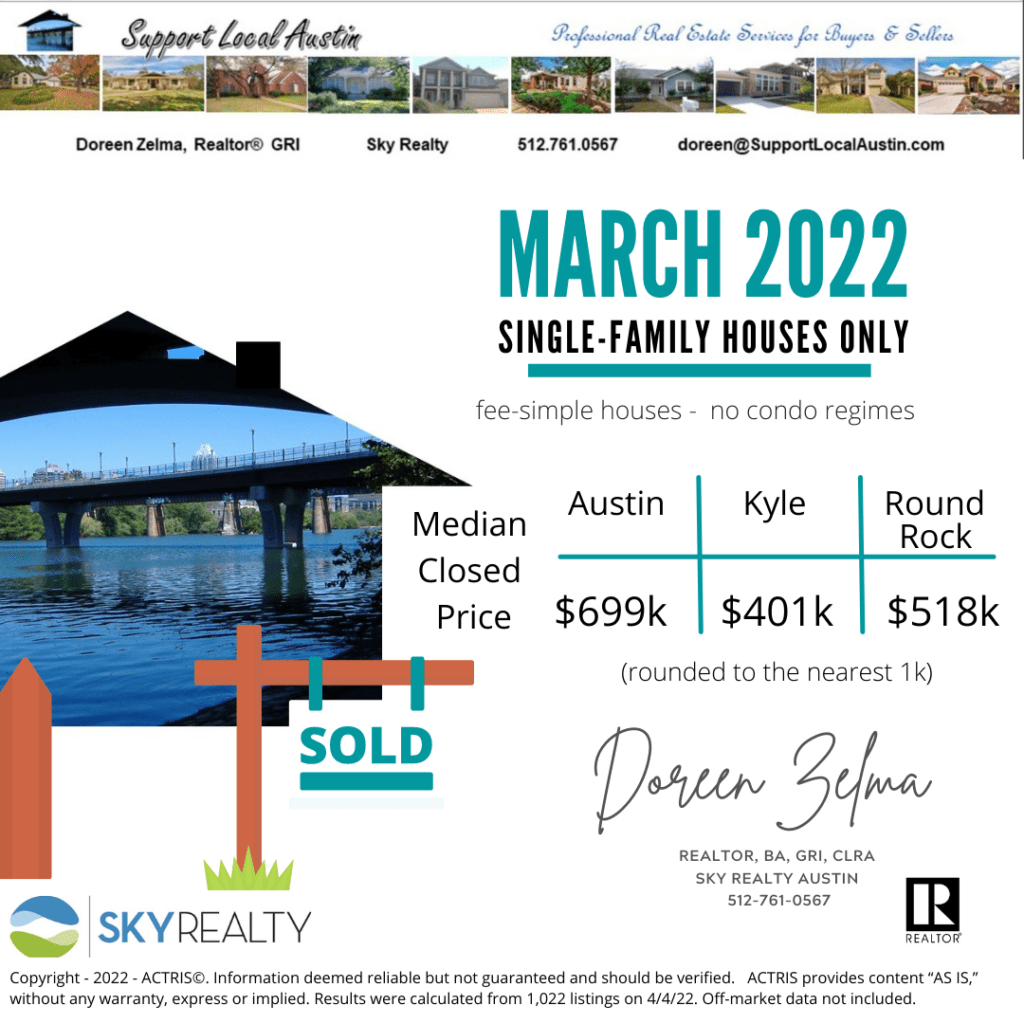
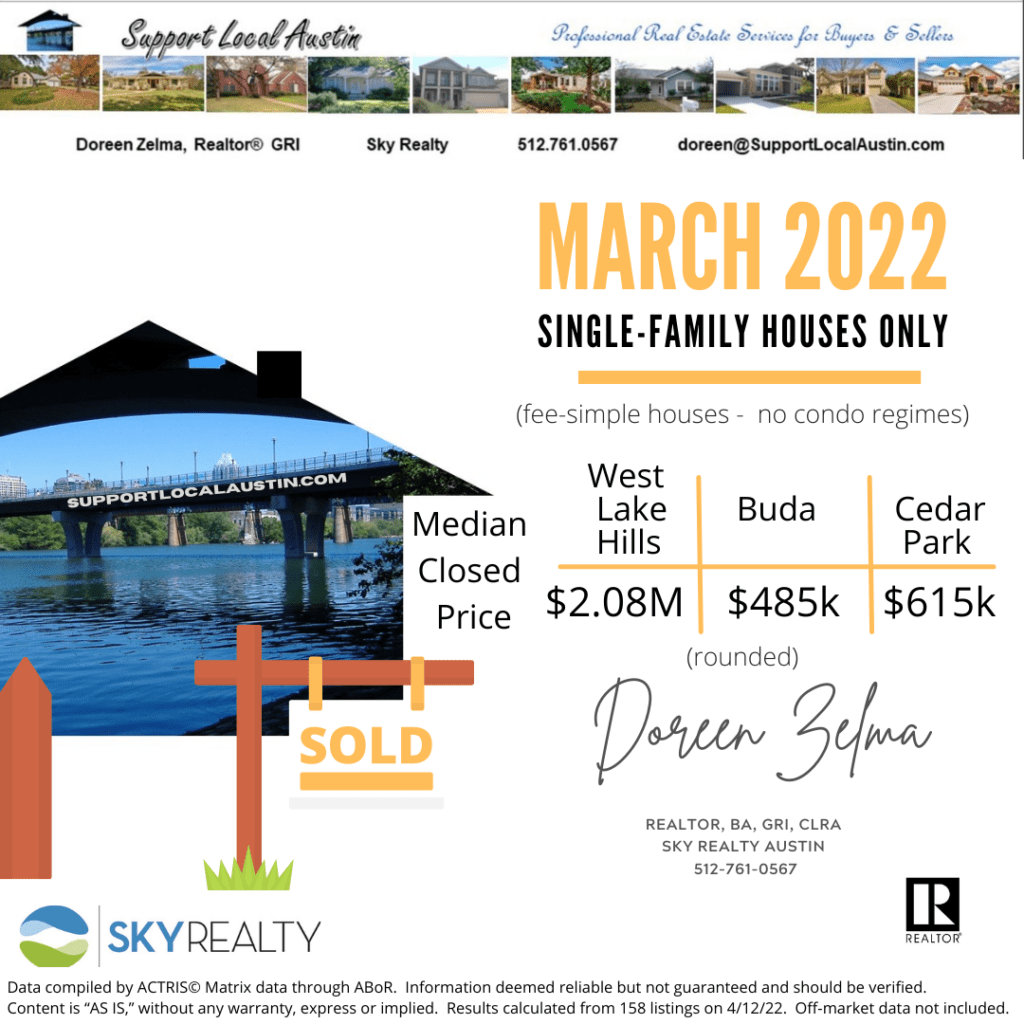
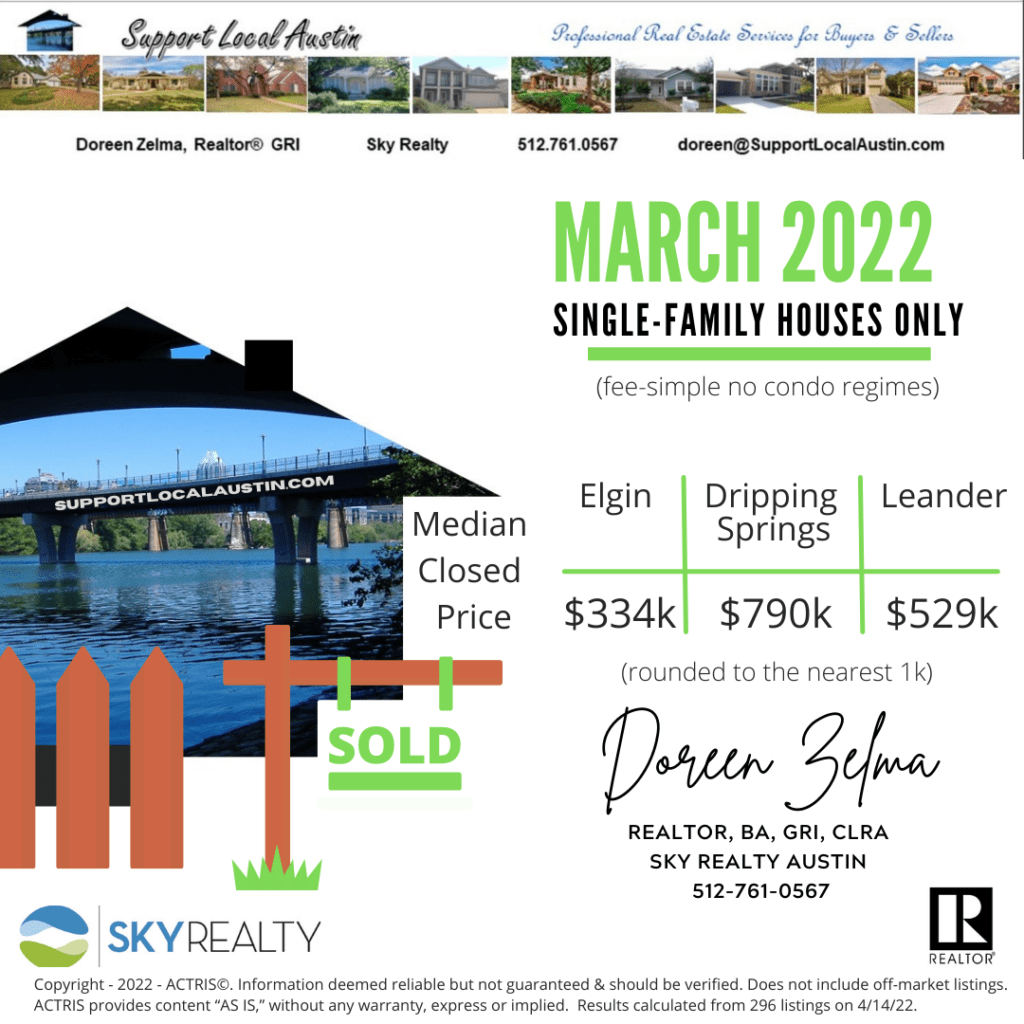
Data compiled by ACTRIS© Matrix data through ABoR. Information deemed reliable but not guaranteed and should be verified. Content is “AS IS,” without any warranty, express or implied. Results were calculated from the number of listings in the MLS at the date of the report. Off-market data not included.
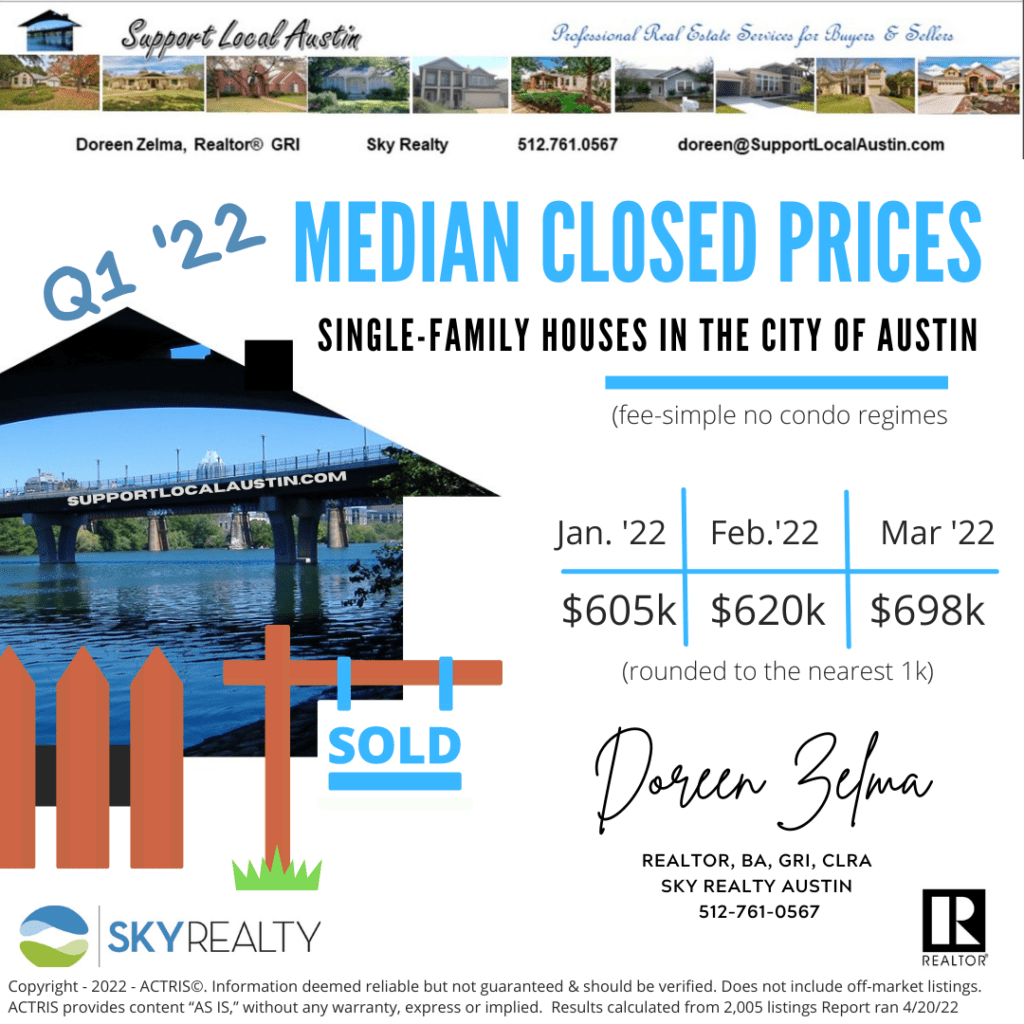
City of Austin Month by Month Snapshot of Sold Single-Family Houses
The first quarter of 2022 is already over. Here’s a month-by-month snapshot of what the 2022 real estate market currently looks like for single-family houses not in a condo regime within the City of Austin.
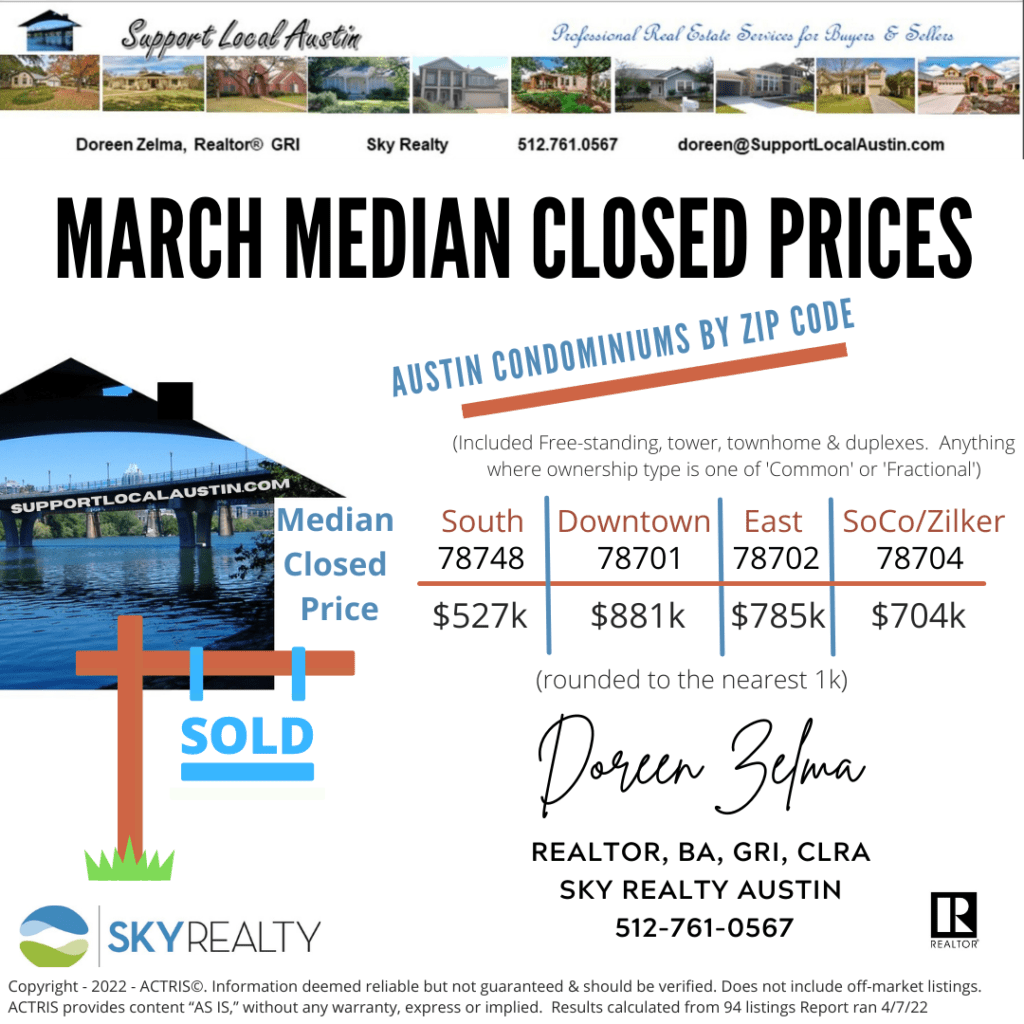
City of Austin Condo Market Snapshot
I ran this report focusing on the zip codes that had the most sold inventory. This report was run on 4/7/22 and was compiled from a total of 94 listings. This report includes all types of residential condos whether they are free-standing (detached), tower, townhome-style, or duplex. All condo regimes were included in this report. All things being equal, a condo dollar tends to go a little further than a fee-simple home. In some locations, they can prove to be a cost-effective alternative.
Want to look at homes? Click here
Ready to start your home search? That’s great news! Contact us and let’s get you on a custom home search and start your path to homeownership today.