

AUSTIN, Texas — The bluebonnets are popping along with the Austin real estate market. Spring is definitely in the air. In February across the Austin-Round Rock-Georgetown MSA, new listings jumped 44.9% to 3,915 listings bringing the total months of inventory for the region to 3 months, up 0.1 months more than February 2023, according to the latest Central Texas Housing Market Report. The data indicates that more owners are ready to sell, giving buyers a broader range of home options to choose from–specifically first-time homebuyers.
Clare Losey, Ph.D., housing economist for Unlock MLS and the Austin Board of REALTORS®, noted that February’s spike in new listings was concentrated among more affordable homes.
“Higher home prices and mortgage rates have diminished affordability for first-time homebuyers over the past few years, but February provided encouragement for these aspiring homeowners. We’ve witnessed a significant surge in new listings, predominantly among more affordable and attainable homes—particularly those priced under $400,000. The increase in housing options presents a promising opportunity for Central Texans who want to become homeowners.”
Austin real estate news: home sales for the Austin-Round Rock MSA comparing month over month between February 2024 and January 2024
✔ Overall, the median sales price was up (from $430,000)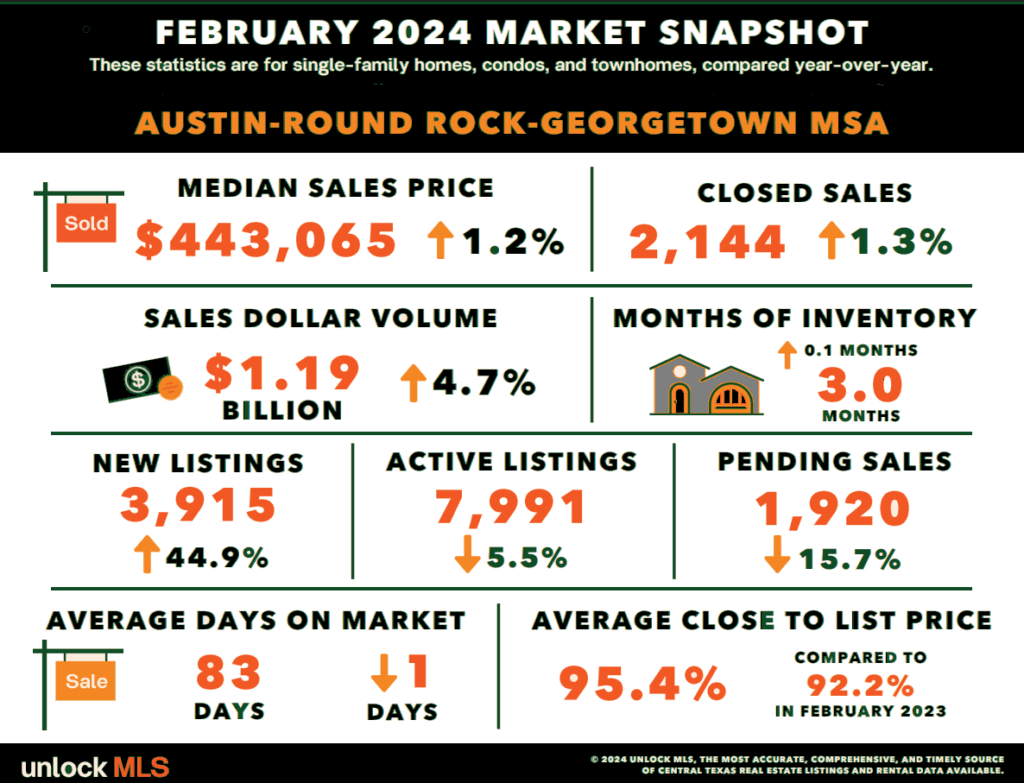
✔ Sold units were up (from 1,667)
✔ New listings were up (from 3,064)
✔ Active listings were up (from 7,976)
✔ Pending home sales were down (from 2,480)
✔ Months of inventory were down (from 3.2)
Kent Redding, 2024 Unlock MLS and ABoR president, provided further insight into current market conditions.
“The spring homebuying season is typically a busy period, especially in the Austin area, where over 35% of annual sales occur between March and June. Buyers are keen on securing homes before the fall and the upcoming school year in August, drawn out by the enhanced curb appeal and favorable weather conditions.”
Austin real estate news market statistics by county for the Central Texas Housing Market February 2024: Median Austin home prices by county
Travis County
- 953 – Residential homes sold, 1.1% more than February 2023.
- $500,000– Median price for residential homes, 0.1% more than February 2023.
- 1,958– New home listings on the market, 42.8% more than February 2023.
- 3,920 – Active home listings on the market, 12.8% more than February 2023.
- 815 – Pending sales, 19.8% less than February 2023.
- 3.2 – Months of inventory, 0.6 months more than February 2023.
- $634,113,309 – Total dollar volume of homes sold, 5.8% more than February 2023.
- 95.2% – Average close to list price, compared to 92.7% in February 2023.
Williamson County
- 777 – Residential homes sold, 2.0% more than February 2023.
- $423,000 – Median price for residential homes, 1.9% more than February 2023.
- 1,172 – New home listings on the market, 41.7% more than February 2023.
- 2,234 – Active home listings on the market, 26.6% less than February 2023.
- 655 – Pending sales, 19.4% less than February 2023.
- 2.4 – Months of inventory, 0.6 months less than February 2023.
- $369,621,394 – Total dollar volume of homes sold, 4.6% more than February 2023.
- 95.5% – Average close to list price, compared to 92.3% in February 2023.
Hays County
- 290 – Residential homes sold, 6.5% less than February 2023.
- $385,000 – Median price for residential homes, 1.6% less than February 2023.
- 549 – New home listings on the market, 56.4% more than February 2023.
- 1,289 – Active home listings on the market, 8.1% less than February 2023.
- 312 – Pending sales, 4.3% less than February 2023.
- 3.4 – Months of inventory, 0.3 months less than February 2023.
- $139,721,421– Total dollar volume of homes sold, 5.2% less than February 2023.
- 95.3% – Average close to list price, compared to 91.7% in February 2023.
Bastrop County
- 92 – Residential homes sold, 7.0% more than February 2023.
- $351,875 – Median price for residential homes, 7.2% less than February 2023.
- 160 – New home listings on the market, 32.2% more than February 2023.
- 420 – Active home listings on the market, 3.7% less than February 2023.
- 96 – Pending sales, 4.3% more than February 2023.
- 3.8 – Months of inventory, 0.4 months less than February 2023 and the highest inventory in the MSA.
- $39,384,615– Total dollar volume of homes sold, 10.3% more than February 2023.
- 95.4% – Average close to list price, compared to 90.8% in February 2023.
Months of inventory are calculated by dividing the number of homes listed for sale by the average number of homes sold per month within 12 months.
Central Texas Housing Market Median Single-Family Home Sold Prices for Austin, Georgetown, Round Rock, Leander, Pflugerville, Cedar Park, Buda, Kyle, Manor, Liberty Hill and beyond. 

This data combines all residential home types and only lists cities with at least 45 closed sales units to make the top 14.
Sales were up by over 400 homes combined in February over January of the cities listed in Central Texas with the most sales.
️ Of the cities featured: Hutto, Liberty Hill, Round Rock, and Pflugerville showed very little shift in median sold prices month-over-month.
⬇️Median sales prices were down in Jarrell, Leander, Manor, Bastrop, San Marcos, and Georgetown.
⬆️Median sales prices increased MoM for Austin, Buda, Cedar Park, and Kyle.
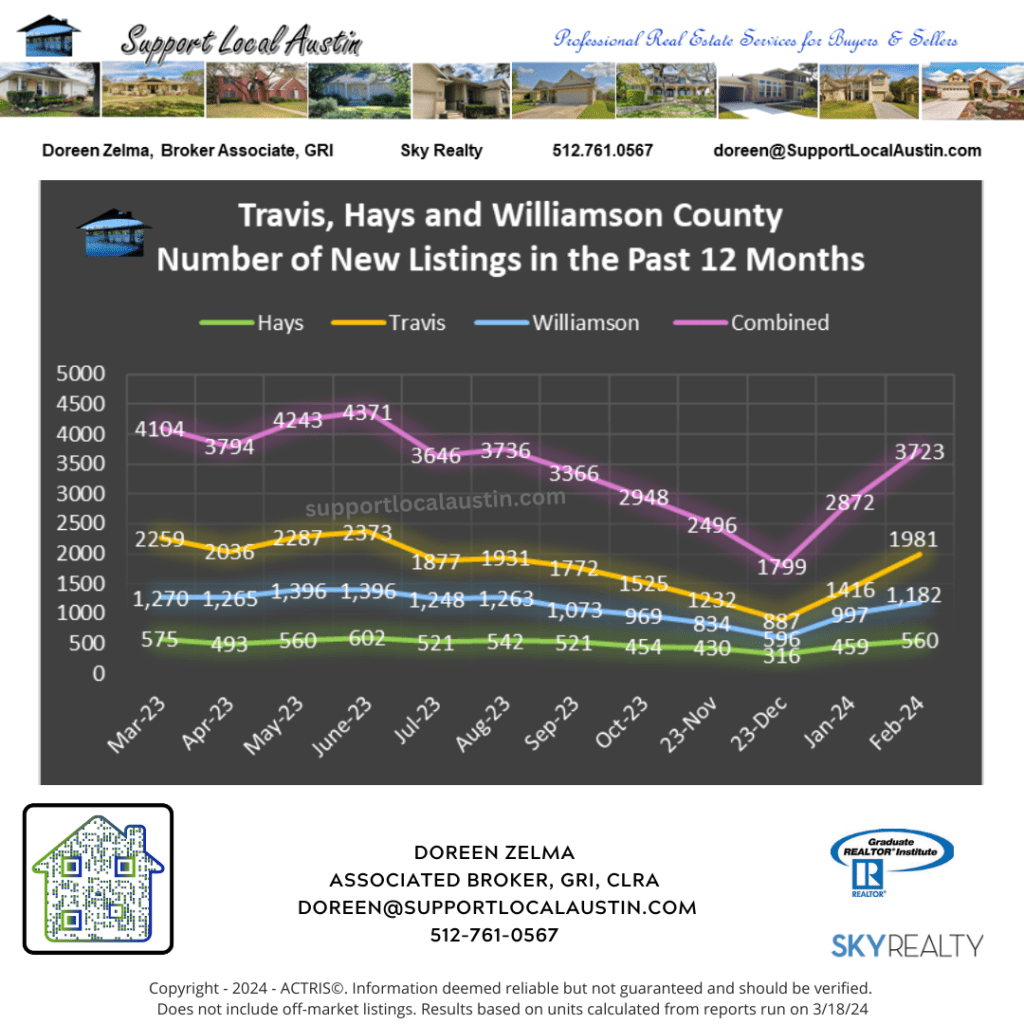
New listings have been trending higher over the last 3 weeks along with price decreases for those listings that weathered the winter slowdown. Inventory is like a box of chocolates right now. The number of choices is largely based on where a buyer is looking. Home builders are still offering a variety of incentives, resale buyers either have cash or have shifted their expectations to marry up with what they can afford. Interest rates seem to have settled into the mid-6s to low 7s, at least for now. Like the bluebonnets, spring is in the air for Central Texas Real Estate too. Like spring, the market is already starting to show signs of warming up with increased foot traffic at open houses and decreased time on the market.
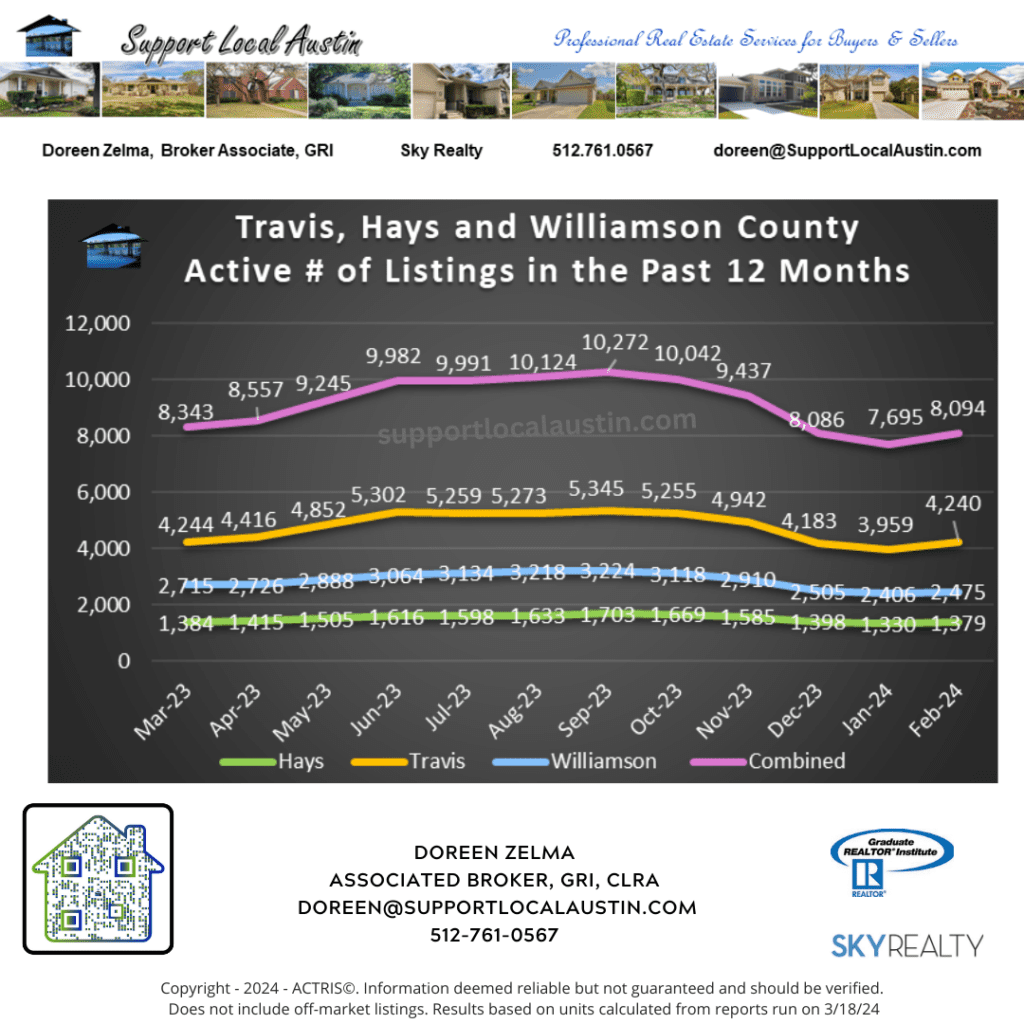
Central Texas Market l New Homes for Sale in Austin and other cities that fall within the counties of Travis, Williamson and Buda 12-month snapshot.
How’s the real estate market here in Central Texas? Listings are starting to bloom.
️ By the numbers, the Austin Round Rock metro new listings are starting to entire the market. We all have a bit of spring fever here in Central Texas and it’s showing up in the number of homes entering the market. Month-over-month active listings are up about 5%.
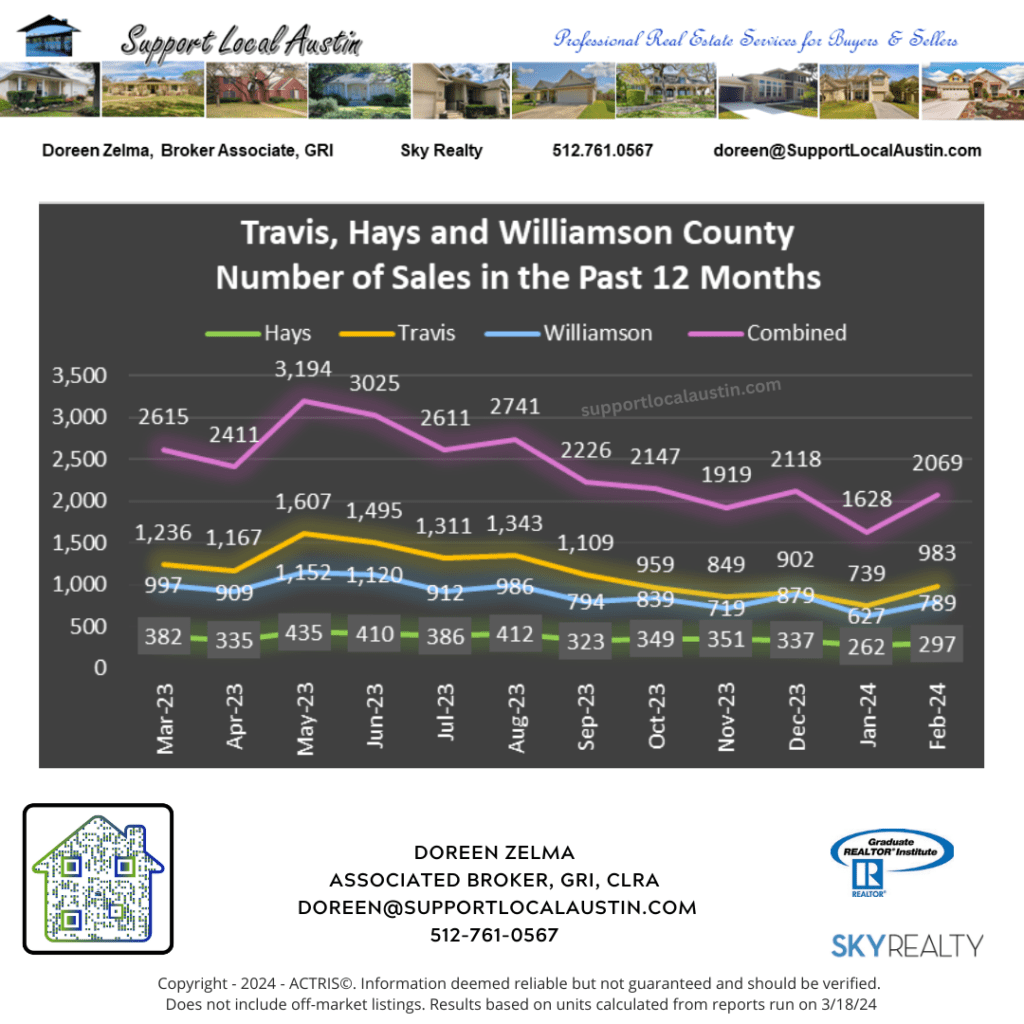
With three months of inventory, we are still in a sellers’ market by the amount of homes for sale, but the market is beginning to sprout with more choices. Year-over-year, there isn’t much of a difference in the number of home sales (Feb. ‘23 had 2,025), but there was certainly a jump month over month.
The market has been playing a bit of red-light green-light again. When interest rates start with a six, buyers come out. When interest rates hit seven percent, the market slows down again.
Ready to get into the Austin real estate market and buy a home in Austin or sell one in Central Texas?
Contact me today! I am more than just an Austin Real Estate Agent and more than an Austin REALTOR®, I am a Broker Associate and have been serving the Austin real estate market for 17 years.
Ready to start your Austin home search? Not sure what your driving commute will be like? Put that smartphone to work.
Want to look at homes for sale in Austin? Start your Austin home search.
Don’t want to do any work and have the homes for sale in Austin delivered to your inbox? Let’s create a custom Austin home search or any city in central Texas and start your path to homeownership today.
Click here to search for homes, find homes for sale in Austin and all metro area cities in the MSA.
Austin real estate market data compiled by ACTRIS© Matrix data through ABoR. Information deemed reliable but not guaranteed and should be verified. Content is “AS IS,” without any warranty, express or implied. Results were calculated from the number of listings in the MLS at the date of the report. Off-market data not included.