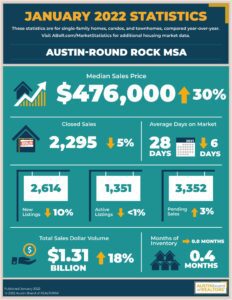
What does the Austin real estate market look like? The Austin-Round Rock MSA housing market in January experienced an overall decline in closed sales compared to January 2021 as the number of closed listings fell 5.8% to 2,295, according to the Austin Board of REALTORS® latest Central Texas Housing Report.
Austin Real Estate Housing Market Statistics for Austin – Round Rock MSA
In January, the median sales price rose 30.4% to $476,000, a record for the month of January—and sales dollar volume rose to 18.2% to $1,318,618,884. New listings decreased 10.1% to 2,614 as active listings also dropped 0.7% to 1,351. Pending listings increased 3.8% to 3,352, as months of inventory stayed flat at 0.4 months. Homes spent an average of 28 days on the market, down six days from January 2021.
 “This was the second-most active January on record in our market,” Cord Shiflet, 2022 ABoR president, said. “We need to make it easier to build homes across all price ranges in the region so that anyone who wants to own or rent a home has the opportunity to do so. Recent housing development announcements across the region like Trinity Ranch in Elgin and Prairie Lakes in Hays County are welcome news, but our community— including elected officials— needs to do more to address the systemic issues we face when it comes to getting new homes built quickly and residential redevelopment projects completed faster.”
Austin Real Estate and all of Central Texas remains in a Seller’s Market
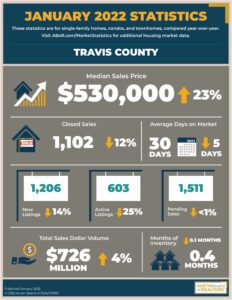 Austin Round Rock MSA January year-over-year price increases as originally reported in the latest Austin Board of Realtors Central Texas Housing Report.
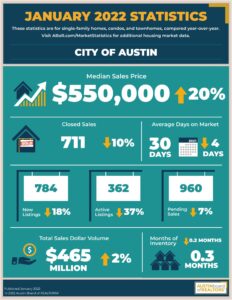
🔑City of Austin — $550,000, up 20.9% from a year earlier.
🔑Travis County — $530,000, up 23.8% from a year earlier.
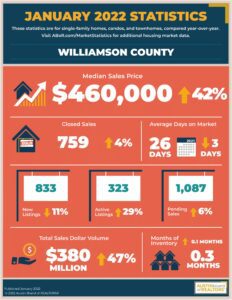
🔑Williamson County — $460,000, up 42.2% from a year earlier.
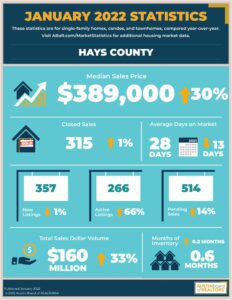
🔑Hays County — $389,000, up 30.1% from a year earlier.
🔑Bastrop County — $398,000, up 50.2% from a year earlier.
🔑Caldwell County — $315,000 up 31.3% from a year earlier.
Median Single-Family House Sold Prices for Austin, West Lake Hills, Round Rock, Leander, Elgin, Cedar Park, Buda, Kyle, and Dripping Springs
These are January’s median sold prices for single-family fee-simple houses in Austin and the surrounding cities. I ran these numbers using MLS data from the Austin Board of Realtors. Data is for single-family houses (no condos).
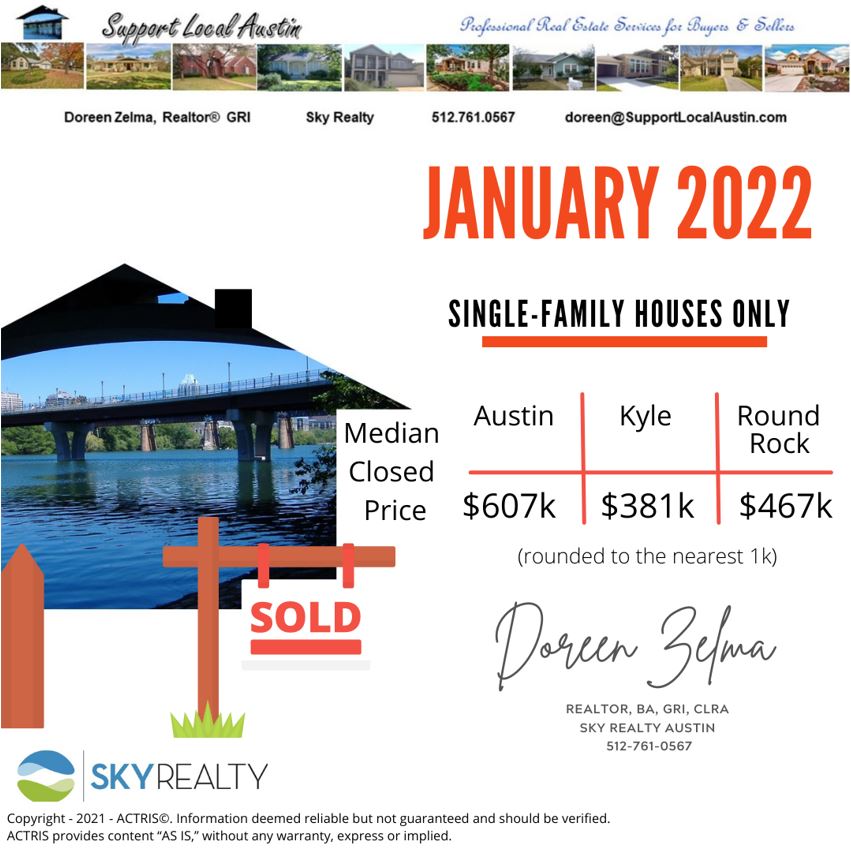
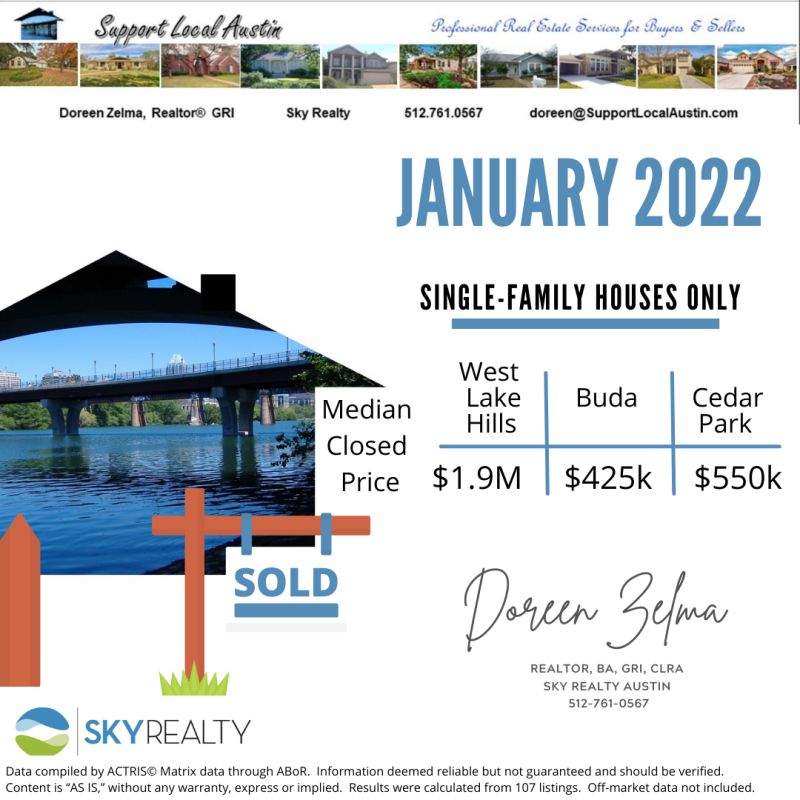
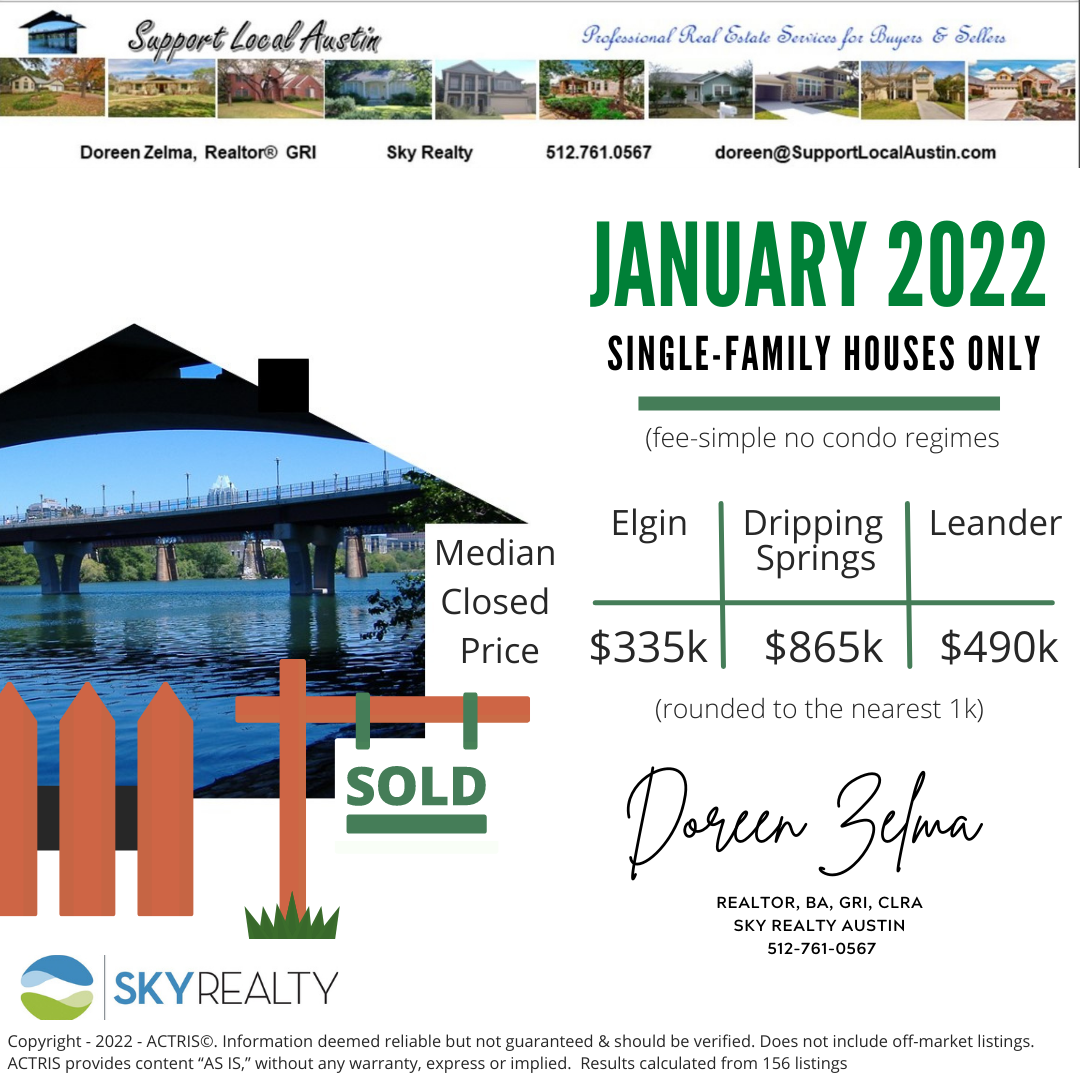
Data compiled by ACTRIS© Matrix data through ABoR. Information deemed reliable but not guaranteed and should be verified. Content is “AS IS,” without any warranty, express or implied. Results were calculated from the number of listings in the MLS at the date of the report. Off-market data not included.
Austin is weird. Why should selling a home here be any different?
