 Austin real estate market news for December 2023 is here. The Central Texas housing data shows that the Austin Round Rock MSA dropped 8.4% to $424,450 last month. The market is now illuminated with an abundance of homes, lower interest rates, and more attractive price tags. If you’ve been dreaming of owning a piece of Austin magic, now might be the time to step out of the cold and into a warm, welcoming home.
According to the Austin Board of REALTORS® November 2023 Central Texas Housing Market Report, the Austin-Round Rock MSA, experienced an increase in active listings, pending listings, and new listings year-over-year giving buyers more choices, and with a slower market, more time to decide than last year. Month over month we see a seasonal shift in November, which can mean a softer market ripe with opportunity for those that stay in it.
Austin real estate news: home sales for the Austin-Round Rock MSA comparing November to October 2023
✔ Overall, the median sales price was down (from $435,000)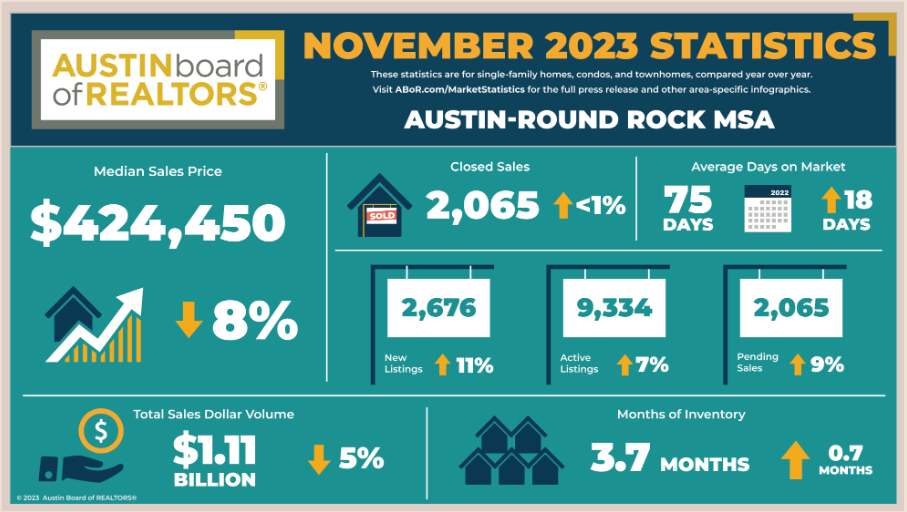 ✔ Sold units were down (from 2,337)
✔ New listings were down (from 3,202)
✔ Active listings were down (from 9,942)
✔ Pending home sales were down (from 2,257)
✔ Months of inventory were down (from 3.9)
“Buyers in Central Texas now have a more abundant selection of homes to peruse than in previous years,” Ashley Jackson, 2023 ABoR president, said. “The drop in median home prices indicates buyers can be a little more selective in the search for a home that checks all their boxes. For buyers actively shopping for a home—and those who have been sitting on the fence waiting for their time to strike—now is the time to contact your REALTOR® and get serious about buying a home.”
Central Texas Housing Market Median Single-Family Home Sold Prices for Austin, Georgetown, Round Rock, Leander, Pflugerville, Cedar Park, Buda, Kyle, Hutto, San Marcos and beyond

Clare Losey, Ph.D., housing economist for ABoR, noted that elevated mortgage rates are contributing to the decline in home prices and an increase in active listings as homes remain on the market for longer.
“A rise in mortgage rates reduces buyers’ purchasing power, so the moderation in home prices helped to offset some of the decline in affordability. However, rates peaked in late October and early November, signaling a rise in buyers’ purchasing power moving into 2024.”
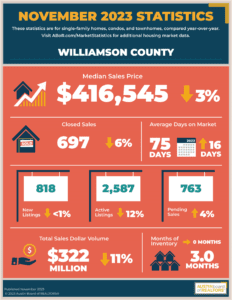
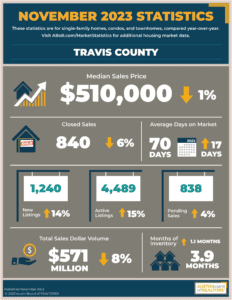
Austin real estate news statistics by county for the Central Texas Housing Market November 2023
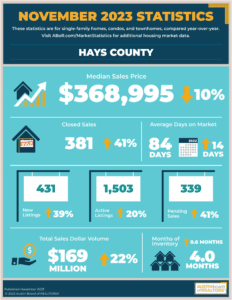
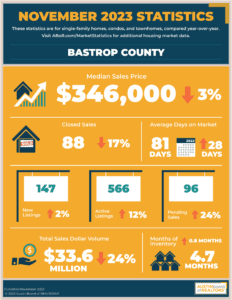
Months of inventory are calculated by dividing the number of homes listed for sale by the average number of homes sold per month within 12 months.
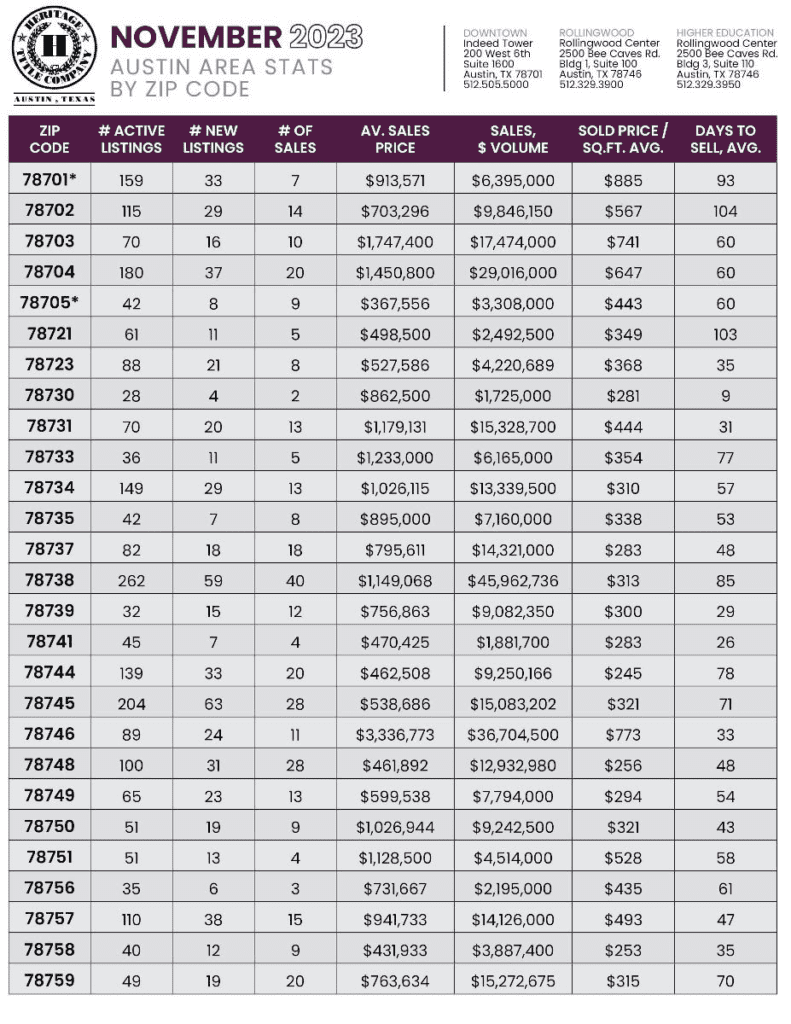
Austin home prices for single-family houses broken down by Austin zip codes, brought to us by Heritage Title Company.
Note that the 78701 (Downtown) and 78705 (UT) areas include condos because they are the predominant dwelling type in those zip codes.
Central Texas Median Closed Prices Graphed
This was based on at least 44 sold units per city. All residential home types are included. Austin, Liberty Hill, and Cedar Park had the highest median sold prices, while Jarrell, San Marcos, and Bastrop came in at the lowest.
Ready to get into the Austin real estate market and buy a home in Austin or sell one in Central Texas? Your Austin home search starts here.
Contact me today! I am more than just an Austin Real Estate Agent and more than an Austin REALTOR, I am a Broker Associate and have been serving the Austin real estate market for 17 years.
Ready to start your home search? Not sure what your driving commute will be like? Put that smartphone to work.
Want to look at Austin homes for sale? Start your Austin home search and other cities in Central Texas.
Don’t want to do any work and have the homes just come to your inbox? Let’s create a custom Austin home search or any city in central Texas and start your path to homeownership today.
Click here to search for homes
Austin real estate market data compiled by ACTRIS© Matrix data through ABoR. Information deemed reliable but not guaranteed and should be verified. Content is “AS IS,” without any warranty, express or implied. Results were calculated from the number of listings in the MLS at the date of the report. Off-market data not included.

